Logic as a graph
A visual script is the scene's logic drawn as nodes instead of typed: an event on the left, wired to what it changes. It does everything a written script does, and it runs beside the script, in the same sandbox.
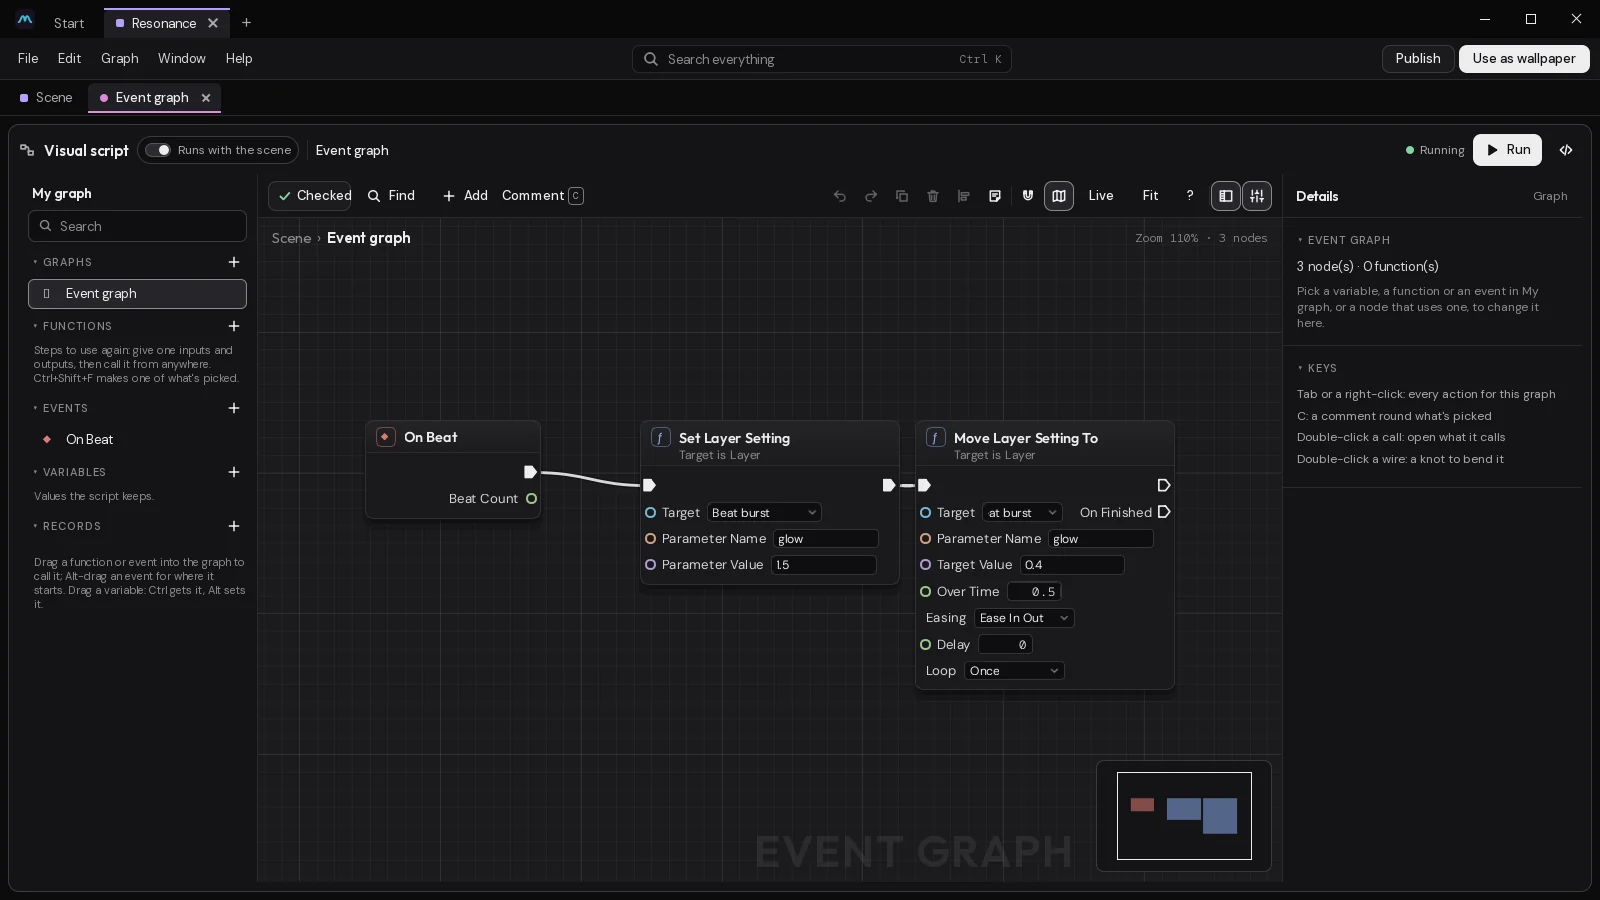
Opening it
Open the Event graph tab. Or select Scene at the top of the Outliner and click Start one (later Open) on its Visual script card. In the command palette (Ctrl+K) it's Logic as a graph.
The first time, Studio gives you a small graph to start from: On Scene Start writes a hello in the log, and On Click goes through a Flip Flop that fades your top layer down and up again. Click the preview to see it work, then change it or take it out.
Along the top of the editor:
- The switch says Runs with the scene or Off. Off, the graph is kept but doesn't run.
- The dot says Running, Not running or A problem in the graph. When the problem is in another graph, Show opens it.
- Run runs the scripts again from the start. The graph also runs again by itself a moment after each change.
- The code button shows the graph as TypeScript, and what the scripts say (see below).
The tab's × closes the editor. The graph keeps running.
The editor
The middle is the graph. On the left is My graph: the graphs, functions, events, variables and records you've made, with a search. On the right is Details, for whatever you've picked.
Adding nodes
Tab (or Shift+A), a tap of Space, a right-click or a double-click on the floor opens the node search. Type a few letters of what you want ("beat", "mix", "random"). Let go of a wire on the floor and the search shows only nodes that fit that wire, and wires the one you pick.
Each node is named for what it does in a scene: events start with "On" (On Scene Start, On Tick, On Beat, On Click), what reads something starts with "Get" (Get Scene Time, Get Setting), and the rest say what they do (Set Layer Setting, Spawn Mote, Lerp Colour). Each page in the reference lists the node under that name, and the search finds it by any word of its name or of what it does.
They're grouped: Events, Utilities|Flow Control, Variables, Functions, Values, the Math groups (Math|Number, Math|Vector 3, Math|Colour and the rest), the Utilities groups (Utilities|Text, Utilities|List, Utilities|Set, Utilities|Map, Utilities|Record), Scene, Motes, Rendering, Audio, Input, Store, Development and Graph, among others. Every one is in the script node reference.
Wiring
There are two kinds of wire.
- Exec wires are white. They say what happens next, and run from an event through flow and action nodes: On Click then Move Layer Setting To then Print.
- Data wires carry values into inputs, and take the colour of what they carry: a number, text, a colour, a layer, a list. A value is worked out each time something reads it.
Drag from a pin to a pin on another node, either way round. Drag a wired input away to move or unplug it. Alt and a click on a pin or a wire takes its wires out. Double-click a wire for a dot to bend it round. Drop a lone node on a wire and it's put in the wire's way.
An input with nothing plugged in shows its value on the node, to type or pick. Some pins are wildcards: they take their type from the first wire plugged in. While you drag a wire, the pins it can't go into fade, and over one of them the wire turns red with a cross. Let go there and it says why, for example "This wire carries text, but this takes a number".
Moving around
Drag with the middle or right button, or with Space or Alt held. The wheel zooms at the pointer. F fits what's picked, Home fits everything, and H folds the picked nodes to their titles. Ctrl+C, Ctrl+V copy and paste, between graphs too, and Ctrl+D duplicates. The ? button lists every key.
Events
A graph starts at its events. The common ones are On Scene Start, On Timer, On Tick, On Click, On Beat and On Settings Changed. There are more for the pointer, the time of day, loud and quiet sound, pausing and resizing, and On Became True, which fires each time what's plugged into its Condition turns from false to true.
From an event, wire actions: Set Layer Setting, Move Layer Setting To, Set Layer Visibility, Set Text Placeholder, Print. Flow nodes decide what runs: Branch, Delay, Flip Flop, For Each Loop and many more.
Nodes for most of what code can do sit beside them: Burst Particles and Set Spawn Rate for particle layers, Play Video and Seek Video, Play Timeline and On Timeline Marker, Set Camera Orbit, Set Effect Setting, Clone Layer, Play Sound, Make Joint, Get Now Playing, Get Calendar Events, Get Battery, Get Live Layer Setting, On Layer Clicked, On Mouse Wheel and On Drag. Move Layer Setting To takes an easing, a delay and a loop, and its On Finished goes on when the move gets there.
Every node says what it does, and each pin what it is: hold the pointer over a node's title, or over a pin. The node's help also names the code it is, so moving between the graph and code is easy.
Events in My graph lists the events in this graph, then the scene's own; click one to find it.
Your own events
Under Events, + makes an event of the scene's own, with values it carries. Drag it into the graph for a Call custom event node, which makes it happen; hold Alt as you drop it for the event node itself, where it starts. For a quick named event with no values, there are On Custom Event and Trigger Custom Event.
Variables
Under Variables in My graph, + adds one of a type: a number, a whole number, text, true or false, a colour, a vector, a gradient, a curve, a layer, a date and time, and others.
Pick it to change it in Details: its name, its type and its shape. The shape is one value, a list, a set or a map. A map has two types, its keys and its values.
Drag a variable into the graph for a node: hold Ctrl as you drop it for a node that gets it, Alt for one that sets it. Used in lists the nodes that use it.
A variable can be offered on the desktop: turn on Offer in the wallpaper's settings and give it a Label. A number becomes a slider, true or false a switch, text a box, and a list of colours a palette. Whoever uses your wallpaper can then change it, and your graph reads the new value. Maps and sets stay inside the scene. To keep a value even after the wallpaper restarts, use Remember Value and Recall Value.
Lists, sets, maps and records
A list keeps items in order, a set keeps each item once, and a map finds a value by its key. Each has nodes of its own: Make List, Add, Get Item, Sort List, Shuffle, Make Set, Union, Make Map, Find and the rest, in Utilities|List, Utilities|Set and Utilities|Map.
A record is a few named fields kept together: a name, a colour and a speed, say. Records in My graph makes one; each field has its own type and shape. Drag a record into the graph to make one, or Alt-drag for a node that reads its fields. Its nodes, Make Record, Split Record and Set Record Fields, are in Utilities|Record.
Functions
A function is steps you use again. Under Functions, + offers:
- Function: a graph of its own, with inputs and outputs. It starts at its Function Entry node and ends at a Return.
- Pure function: no exec pins. It's worked out wherever its output is read, like a maths node.
- Function written in JavaScript: its code where the nodes would be.
For longer code of your own, write a method in the scene's script (see Logic as code) and mark it @callable(): it shows up here as a node.
Each function opens in a tab of its own, with a way back to the event graph along the top. Double-click a Call node to open the function it calls. Inside a function, Local variables belong to one call and are gone when it returns.
To make a function of nodes you already have, pick them and press Ctrl+Shift+F (Collapse to function). The wires crossing the edge become its inputs and outputs.
Classes
A class is a kind of object with fields (its variables) and methods (its functions), and events that run for each one made. Under Graphs, + offers a Class made of nodes or a Class written in JavaScript. A class can also go in the scene's script, and a class drawn here can extend it.
- Make object makes a new one; its On Scene Start runs as it's made. The shared one gives the one object of the class every graph shares.
- A folder of layers can be an object too. In the folder's settings, Is an object of picks the class. Inside the class, Get Layer by Name finds one of the folder's layers by name, and Self is the object. From the scene's graph, Get Object by Name finds it by the folder's name.
The scene's classes are also listed in the Assets panel, as templates. Objects have nodes of their own, under Motes and Physics.
Checking and errors
Studio checks the graph as you build it. A node with a problem is marked, and the message says what's wrong: a wire whose types don't go together, a function that no longer exists, an input that needs something. While the graph has a problem it doesn't run.
Live (or L) shows the values going along the wires as the preview plays, a few times a second. Turn it off when you're done: it slows the script a little.
Errors while it runs show in the console, and in the Console tab. Each says which node it came from; click it and Studio opens that graph with the error on the node. Watch Value logs a value when it changes, Breakpoint stops what's happening at that point, and Try catches an error instead of letting the event stop.
There are limits, so a graph can't run away with the wallpaper: 2,000 nodes in a graph and 8,000 in all, 64 functions, 128 variables, a loop of 100,000 turns in one tick, and functions calling each other 64 deep.
The graph and the code
The graph writes code: the same scene calls a script written by hand makes. Click the code button at the top to see the graph as TypeScript beside the nodes: its variables as typed properties, its functions as typed methods, its classes as classes. It's read-only: the nodes write it. Copy as TypeScript copies it, to start a file from.
The graph and the scene's script (see Logic as code) are compiled together, as one, and run together in the same sandbox. The script can use the graph's functions and classes, with their types checked. A class drawn in the graph can extend a class the script writes: pick it under Extends in the class's details. And a script's methods marked @callable() show up as nodes you can use in the graph.
Comments and notes
- C puts a comment box round what's picked. Give it a title and a description; its dot sets its colour and title size. Drag its title and the nodes inside come with it. The chevron folds it to its title bar.
- Shift+C, or right-click and Comment…, puts a bubble above one node. Pin it to show at every zoom, or leave it to show on hover.
- A Note is a sticky note on the floor. It doesn't change anything.
- Reroute dots and Portal In nodes keep long wires tidy.
Last changed 2 November 2026. Something wrong here? Tell us.